Free without login
Open and inspect the record
- Open matching CFG + DAT files
- Review analog relay waveforms
- Inspect digital event transitions
- Zoom, pan and use A/B cursors
- Review Frequency / df-dt
- Check measured values in Read Out
Power system analysis, COMTRADE tools and engineering studies
Open matching files to investigate relay events with synchronized waveforms and timing.
Explore a sample disturbance record and its analysis views. No account needed and no trial credits used.
Open a disturbance record, confirm the relevant source mapping, inspect the measured evidence, and assemble an editable Engineering Report. You control the review and final wording.
Open a record without an account. Registered users receive a time-limited trial with a recording allowance, followed by Single Analysis, Professional Monthly or Professional Yearly access for new analyses. AI fault-analysis reports are purchased separately.
All cloud analysis plans include the available protection workbenches, saved recordings and the Engineering Report builder. AI fault-analysis reports are purchased separately.
Starts with your first successfully prepared recording. Ends when either the time or recording allowance is reached.
Create free accountA prepaid purchase with its own recording allowance and expiry.
Sign up to choose this planA prepaid purchase with its own recording allowance and expiry.
Sign up to choose this planThe full allowance is available immediately. Each purchase has its own expiry.
Sign up to choose this planOne recording = one matching CFG + DAT pair. Failed preparation uses no credit. Reopening a completed recording uses no additional credit.
Prepaid plans have no automatic renewal. Each purchase retains its own expiry. Saved results remain available within your account’s storage-retention policy.
The public sample is free to explore and uses no trial allowance. Your exact available offer is shown before checkout.
Optional and charged separately from recording analysis plans. Review the report quotation before payment.
Start with the recorded signals. Confirm the source mapping and required inputs, then prepare a report from the evidence you review.
Choose matching CFG and DAT files. Review waveforms and digital channels in the free viewer, or explore Sample DR.
For registered analysis, confirm the relevant channel mapping. Review cursor measurements, event timing and supported workbenches with the required inputs.
With registered trial or analysis access, select evidence in the editable Engineering Report builder and review the final wording. AI reports are optional and purchased separately.
Use explicit mappings, recorded measurements and editable reports to keep each investigation grounded in the available evidence.
Confirm the relevant recorded channels and apply the source mapping used by supported calculations.
Review recorded measurements, cursor and event times, and selected snapshots alongside the report context.
Registered trial or analysis access includes the editable Engineering Report builder. Choose the evidence and control the final wording.
Inspect current and voltage channels with synchronized time axes, zoom, pan and cursor measurements.
Review pickup, trip, breaker and auxiliary transitions with measured event timing.
Examine frequency behaviour and rate-of-change evidence from suitable recorded channels.
Use signed-in views for vectors, sequence quantities, power and derived evidence.
Review apparent impedance, trajectory and location support when the required settings are available.
Check operate/restraint evidence when suitable differential channels are available.
Assemble selected evidence in an editable engineering report builder.
Order paid AI-assisted fault analysis separately after reviewing the available evidence.
Preview the additional views used for phasors, impedance, fault location and power evidence after sign-in.
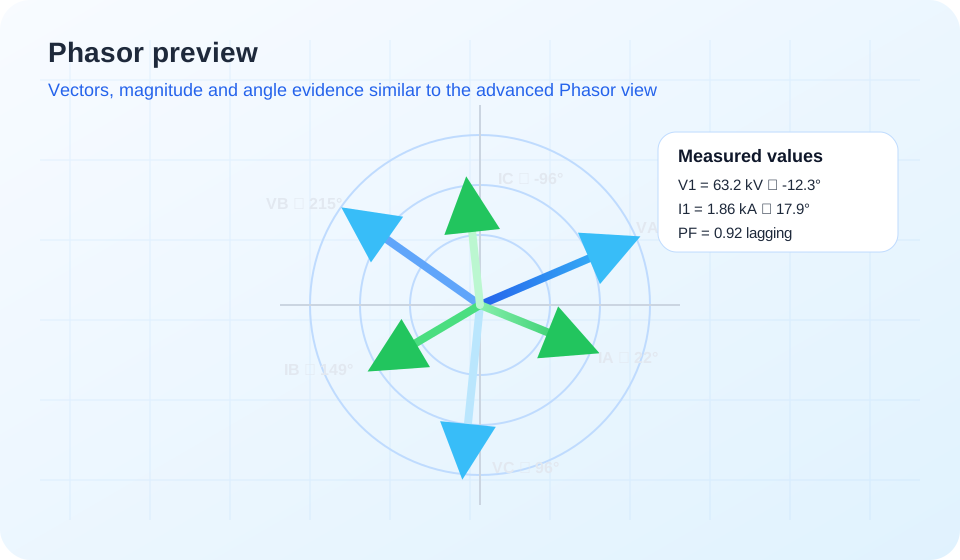
Preview current and voltage vectors with angle and magnitude evidence in the advanced Phasor view available after sign-in.
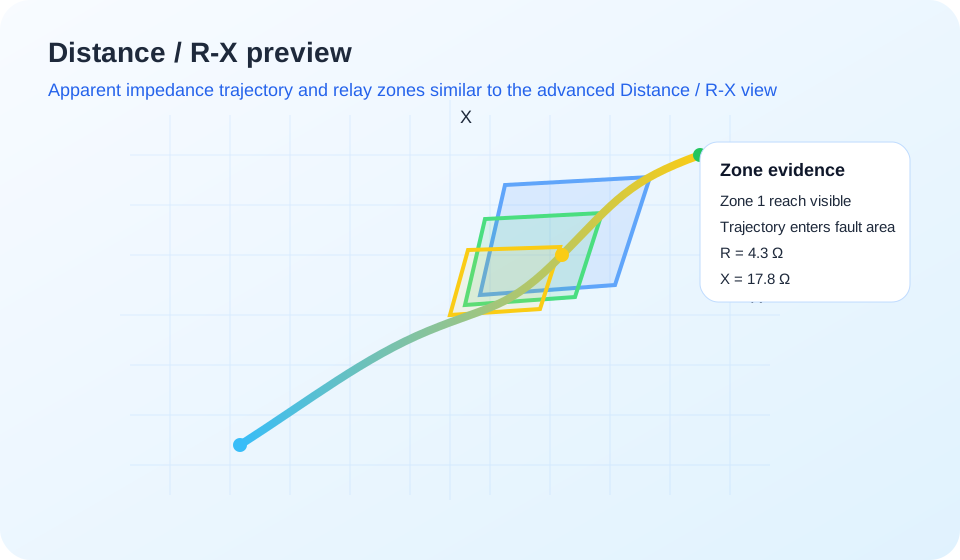
See how impedance trajectory and relay zones can be reviewed in the advanced Distance / R-X view after sign-in.
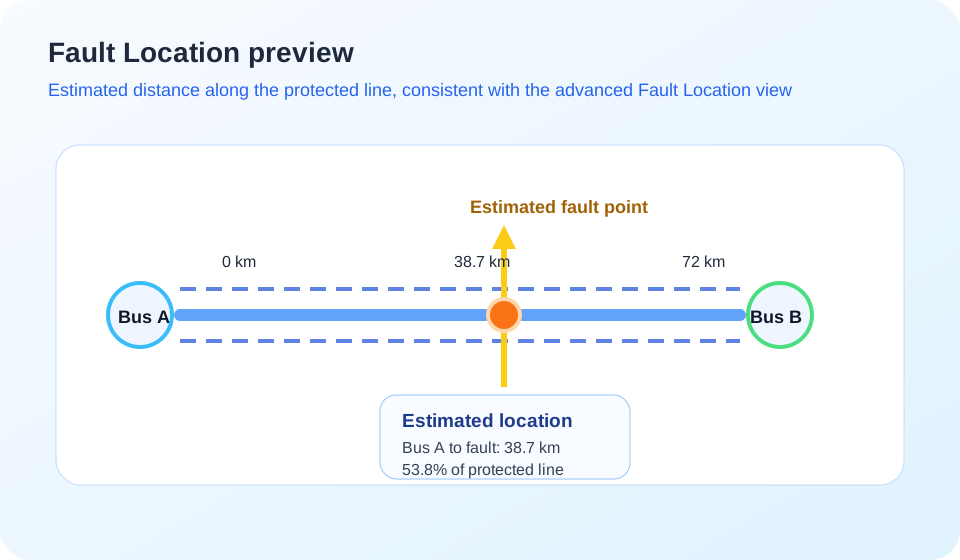
When the required settings are available, signed-in users can review estimated fault distance along the protected line.
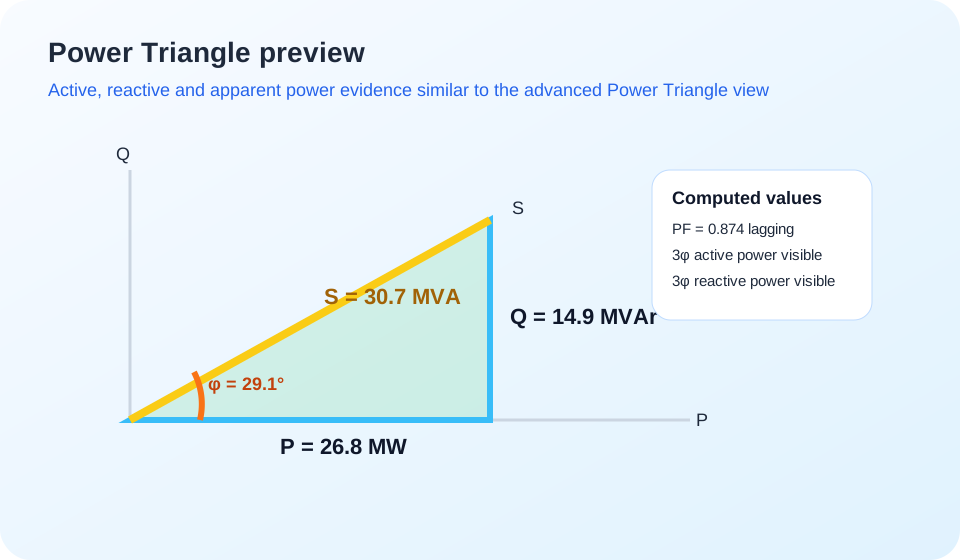
The Power Triangle connects measured voltage and current quantities with active, reactive and apparent power evidence.
Practical answers about opening disturbance records, free tools, registration and reporting.
COMTRADE is a standard format used by protection relays, disturbance recorders and power-system monitoring devices to store sampled analog signals, digital states and event timing. A record commonly uses a CFG configuration file together with a DAT waveform file.
Yes. Choose the matching CFG and DAT files in the upload section above and select Analyze Waveform. ZeroRiskk supports common COMTRADE 1991, 1999 and 2013 records, including ASCII, BINARY, BINARY32, FLOAT32 and FLOAT64 data.
Visitors can use the free online viewer for waveform review, analog and digital channels, cursor timing, Frequency / df-dt and Read Out. A registered account includes a limited free trial of cloud analysis and advanced protection views. Single Analysis, Professional Monthly and Professional Yearly purchases enable new analyses after the trial ends. Saved results follow the storage-retention policy.
No. The visitor viewer runs in a modern web browser, so a protection engineer can begin reviewing a disturbance record without installing a desktop COMTRADE application.
Yes. The viewer displays analog current and voltage channels together with digital pickup, trip, breaker and auxiliary-state transitions when those channels are available in the uploaded record.
During your free trial you can save and reopen records, use applicable Phasor, Computed, Fault Location, Distance / R-X and Differential views, and prepare engineering reports. Choose Single Analysis, Professional Monthly or Professional Yearly for new analyses after the trial ends.
No. AI Fault Analysis & Report is a separate paid report option for registered users. Visitor waveform viewing remains free. Registered cloud analysis follows the trial and membership allowance.
Yes. Registered users can assemble selected waveform, timing and protection evidence in the Engineering Report builder. The separate paid AI report is used only when AI-assisted fault interpretation is requested.
Use the upload section above for immediate waveform review, or create a free account to save records and unlock advanced protection-analysis views.
ZeroRiskk SLD Studio connects the electrical single-line diagram to the study model. Build a multi-voltage network, validate study readiness, calculate balanced AC load flow, and perform IEC 60909-0:2026 Edition 3 short-circuit studies without rebuilding the network in a separate calculation tool.
The SLD is the engineering model. Equipment properties, service state, voltage levels and connectivity are compiled into the study network so Load Flow and Short Circuit remain tied to the diagram the engineer is reviewing.
Draw a multi-voltage single-line diagram with data-driven equipment and structured engineering properties.
Run balanced positive-sequence AC load flow and return operating quantities to the same project model.
Use the same network for IEC 60909-0:2026 Edition 3 short-circuit calculations and protection-engineering review.
ZeroRiskk keeps study preparation visible rather than hiding missing data behind assumed values.
Build the network graphically across the required voltage levels.
Use structured properties for study-relevant electrical parameters.
Resolve topology, rating, grounding or parameter gaps that matter to the study.
Review voltage profile, power flow, loading, losses and violations.
Review fault level, source contribution, branch current and device duty.
The study views keep different engineering quantities separate so bus fault level, source contribution, branch current and interrupting-device through-current are not presented as if they were the same measurement.
Bus voltage in pu/kV, angle and deviation against the selected operating band.
Active/reactive flow, apparent power, power factor, source balance and network losses.
Branch current, loading percentage, loading margin and overloaded-equipment checks.
Flow direction for operating studies and focused fault-current reconstruction where determinable.
Initial symmetrical short-circuit result for assessed buses and selected study cases.
Grid, generator, motor and converter contributions kept distinct from the bus total.
Device screening against configured ratings with focused through-current where unambiguous.
Transformer vector-group, sequence and grounding information carried into supported earth-fault studies.
The equipment library supports multi-voltage network modelling while keeping the parameters used for Load Flow and Short Circuit attached to the drawn equipment.
These illustrations show the type of engineering evidence the workspace is designed to present. Values below are examples, not calculated project results.
Review bus voltage and angle, active/reactive power, branch direction, current, loading margin, grid import/export, losses and operating-limit violations from the compiled SLD.
Assess four supported shunt-fault categories, maximum/minimum cases, source contribution, peak/thermal quantities, focused directional branch currents and interrupting-device screening.
Engineering-focused answers about the SLD, load-flow and short-circuit capabilities currently implemented in ZeroRiskk SLD Studio.
ZeroRiskk SLD Studio combines electrical single-line-diagram authoring with balanced AC load-flow analysis and IEC 60909-0:2026 Edition 3 short-circuit studies. The same project topology and equipment data are used to move from drawing the network to operating-condition and fault-duty calculations.
Yes. Load Flow and Short Circuit are study modes of the same SLD project. You model the network once, set the applicable operating and short-circuit data, validate study readiness, and run the required study without rebuilding the system in a separate drawing.
The current model includes grid sources, synchronous and induction generators, converter sources, synchronous and induction motors, static loads, two-winding and three-winding transformers, autotransformers, earthing transformers, busbars, cables, overhead lines, conductors, series and shunt reactors, capacitor banks, circuit breakers, disconnectors, fuses, contactors, reclosers, neutral grounding resistors, CTs, VTs, CVTs, CBCTs, neutral CTs, earth points and protection IED symbols. Study participation depends on the engineering parameters relevant to each equipment type.
Yes. The SLD can contain multiple voltage levels connected through transformers and autotransformers. Study results retain the applicable terminal and winding voltage bases instead of treating the whole project as a single-voltage network.
Load Flow uses a balanced positive-sequence AC Newton-Raphson model. The implemented model includes fixed transformer taps, shunts, voltage-dependent loads, electrical islands and generator reactive-power limits.
The Load Flow workspace provides bus voltage magnitude and angle, solved source and load power, branch-terminal currents and current angles where defined, power factor, equipment loading and rating assessment, power balance, series losses, voltage profile, operating findings and de-energized or indeterminate states where applicable. Missing ratings are kept separate from a within-rating result.
Yes. A calculated Load Flow run can be pinned as a session baseline and compared with a later run after changing the operating case, topology or engineering inputs. The comparison can show changes in voltage, loading, series losses and new or resolved findings.
The Short Circuit study implements IEC 60909-0:2026 Edition 3 calculation workflows for the supported network models and study inputs. Results should be used with verified source, sequence, grounding, topology and equipment-rating data; the software output is an engineering calculation result, not a conformity certificate.
The current Short Circuit workspace supports three-phase faults, phase-to-phase faults, single-phase-to-earth faults and double-phase-to-earth faults. Earth-fault calculations require the applicable sequence-network, transformer connection and grounding data.
Yes. The study supports maximum and minimum fault cases with the applicable IEC voltage-factor and source-case treatment. The selected study assumptions are retained with the result so the calculated duty can be interpreted on the correct basis.
Yes. All-bus short-circuit results can retain bus-indexed source decomposition so the combined bus fault current can be reviewed separately from individual grid, generator, motor and converter contributions. Focused-fault results can also show directional physical-path currents where the network current can be reconstructed unambiguously.
Yes. Where the required ratings and current basis are available, the study can compare calculated short-circuit duty with configured interrupting-device ratings. Bus prospective fault current, source contribution, branch current and device through-current are kept as different result quantities rather than being treated as interchangeable.
Yes. The project model includes transformer connection/vector-group data and winding grounding inputs used by the sequence-network calculation. Two-winding transformers, three-winding transformers and autotransformers have study fields for their applicable connection and grounding arrangements.
Yes. For a selected fault, ZeroRiskk can display the calculated initial fault-voltage result when the pre-fault operating model is available. Three-phase faults show a balanced voltage magnitude, while unbalanced faults can show phase quantities. These are fault-condition RMS estimates associated with the selected fault and are not a transient voltage-recovery or dynamic ride-through simulation.
The results do not automatically treat missing data as a passing condition. Missing continuous or short-circuit ratings remain unassessed, and ambiguous current sharing through ideal parallel paths can remain indeterminate instead of assigning an arbitrary current split.
Yes. ZeroRiskk SLD Studio includes engineering export paths for the single-line diagram and study results, including SVG/PDF diagram output and supported PDF/CSV study-report or schedule exports. Exported values retain the study result basis rather than converting unavailable quantities to zero.
Draw the network once, then use the same SLD for operating-condition and fault-duty studies.